This is the first in a series of three case studies explaining how companies can leverage IPA’s Upstream Project Evaluation System (PES®)[1] and capital projects database to strengthen floating production storage and offloading (FPSO) project performance. This case study describes an FPSO market assessment for a client focused on improving the capital efficiency of its FPSO projects. The other two case studies discuss How a Company New to FPSO Projects Builds Robust Risk Profiles and Measuring the Performance of Harsh-Environment FPSO Projects.
The Client’s Dilemma
IPA was approached by a client with a large portfolio of upcoming floating production storage and offloading (FPSO) projects. The client had little experience executing FPSO projects and limited insight into the market outlook for FPSO project costs and schedules. It contacted IPA seeking information and metrics that would help it better understand how market activity and commodity prices influence FPSO project costs and schedules, and how the current and short- to midterm market outlooks were likely to influence FPSO costs and schedules. The client sought to feed this knowledge back to its planned FPSO projects to support more reliable cost and schedule estimates and better scrutinize contractor-provided cost and schedule estimates. IPA had primarily conducted project benchmarking evaluations for the client, but in this case, the client needed a market assessment to improve its capital efficiency.
IPA’s Market Assessment Approach
IPA’s EMEA regional office, working with our Project Research Division, employed its Upstream Project PES methodology to examine FPSOs and large offshore facilities (topside weight >15,000 metric tons [mt]). We included large topside projects because the FPSO market behaves similarly, given that facilities with a topside weight greater than 15,000 mt are built in a limited number of shipyards. The Upstream PES is a set of models (including asset development cost and schedule metrics, individual facility and well metrics, and subsurface evaluation) based on the statistical analysis of historical industry data.
IPA gathered data on current and historical FPSO market activity and on large topside projects and corresponding indicators using a combination of internal and external data sources. IPA then performed statistical analyses to identify historical trends in the correlation between FPSO and large topside market activity and project costs and schedules. These analyses were done to simulate how the current and near-future market is likely to influence FPSO costs and schedules.
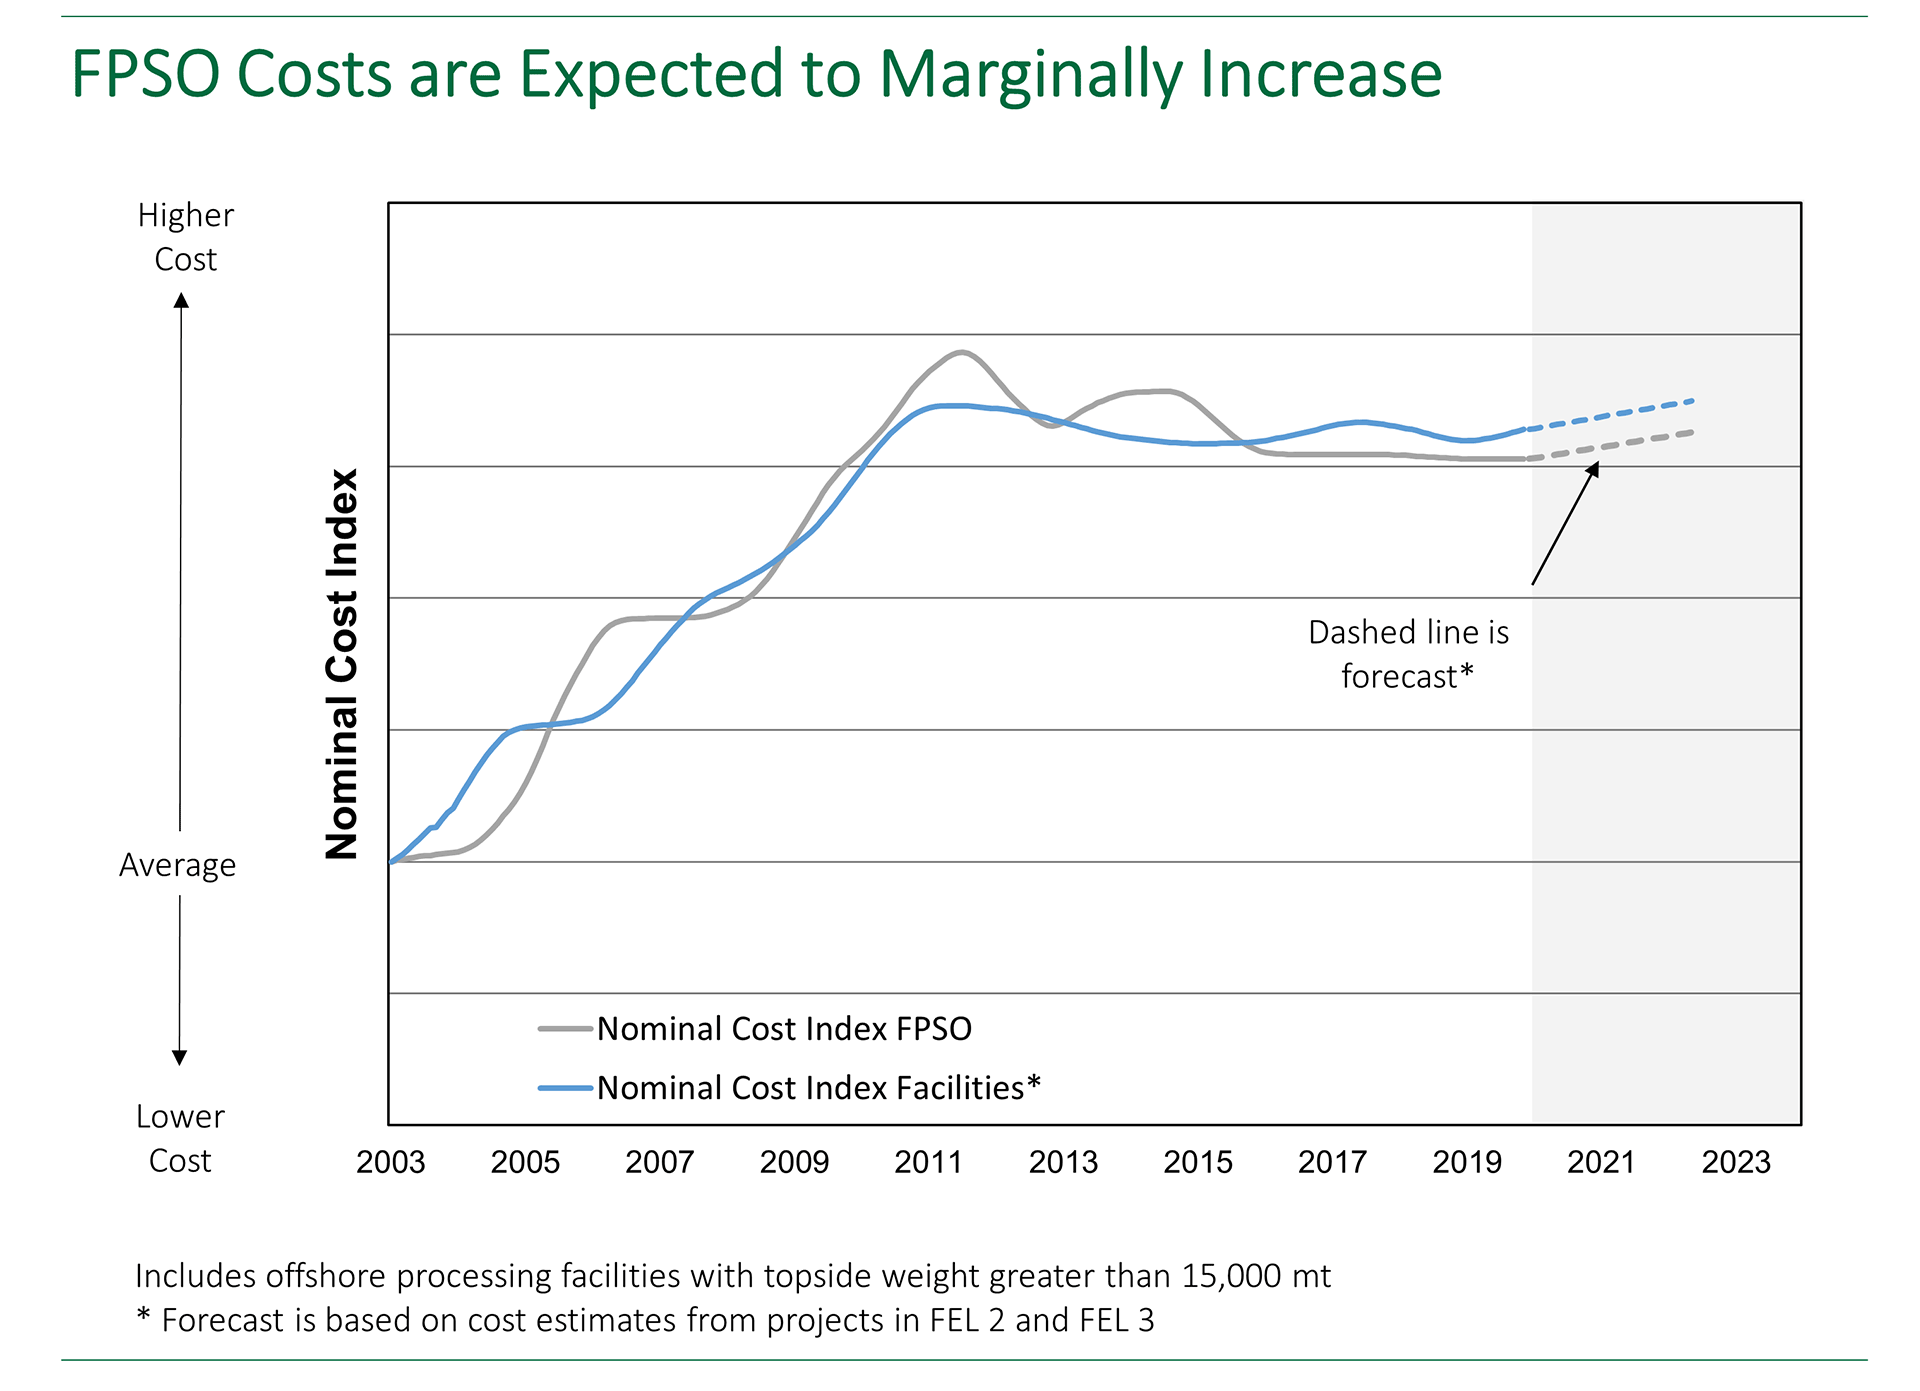
The results found that the FPSO market has recovered since the oil price crash in 2014 and cost effectiveness has also improved since then. However, relative to today, as shown below, FPSO costs are expected to increase slightly in the short- to midterm because demand is expected to grow with increased investment in deepwater and ultra-deepwater developments that necessitate FPSO developments. In contrast, FPSO execution schedules are expected to improve slightly. The trends represent IPA’s view of the FPSO market and indirectly represent the view of owner companies, vendors, and contractors.[2]

FPSO Market Activity Insights
The study provided the client with data-based insights into current and historical FPSO market activity in the industry and how the current and near-future market situation is likely to influence FPSO costs and schedules. The client found IPA’s external, independent viewpoint to be very beneficial to support cost estimating in their current projects and to validate/scrutinize project cost and schedule estimates.
Case study by Matthew Ingham, IPA Project Analyst
[1] PES is a registered trademark of IPA.
[2] The analysis in this study was undertaken prior to the COVID-19 pandemic and the drop in oil prices. FPSO market conditions and supply chains have changed.