THE BACKSTORY
A pharmaceutical company approached IPA looking for insights on the cost and schedule risks associated with a large investment that was approaching full-funds authorization. The project was scoped into a multi-phased megaproject intended to increase production to meet growing market demand. Due to the scale of the project and uncertainty around the supply chain (contractors’ capacity and capability, material prices, etc.), the company wanted a better understanding of the expected risks, as well as the likelihood of the project coming in on time and on budget.
OUR APPROACH
Cost and schedule risk analyses are used by most industry (large) capital projects to estimate the amount of cost and schedule contingency needed to center the base estimates and deterministic schedule. IPA has seen significant variability in the level of maturity across owner companies in terms of implementation of these cost and schedule risk analysis Best Practices. For example, we see project teams conduct purely qualitative risk analysis on schedule, basic quantitative analysis that includes the traditional activity range estimating, modern quantitative analysis that includes risk drivers specified by probability and effect and assigned to all activities they affect, and finally the advanced integrated cost‑schedule risk analysis.
Getting any of these methods to work is hard. For example, one of the challenges in getting a Monte Carlo schedule analysis to work is estimating correlations between activity durations in an effective fashion. Similarly, Monte Carlo-based methods for cost contingency setting fail because, while they focus on individual cost element distributions, cost estimates overrun because some scope elements were not defined—not because the distribution around the individual elements was incorrect. Most industry projects use fabricated distributions that are not based on historically observed and unbiased distributions of outcomes. Additionally, these analyses do not take into account the reality that most project elements are closely connected. Finally, even in cases where the P50 identified by project teams employing risk quantification Best Practices appears reasonable for a particular project, the range around it is often too narrow—usually by a significant margin. Because of these narrow bands of forecast cost and schedule outcomes, projects—notably megaprojects—are often unpleasantly surprised at how bad things can get.
IPA’s approach to quantifying cost and schedule risk is very different because we let history tell us what to expect. Using our database of over 22,000 capital projects, we trained machine learning algorithms to quantify how design maturity, estimate quality and bias (usually too low), planning gaps, and scope- and location-specific characteristics correlate with cost growth and schedule slip. The value here is that across so many projects, we know what the real distribution of outcomes looks like and can present true, unbiased reflections of what is most likely to happen.
For the pharma megaproject in question, the models were calibrated using a set of comparable pharma projects with like processing and facility attributes. That is the first step.
Next, we evaluated the status of the front-end engineering and design work (FEED) and project execution planning—the primary drivers of risk beyond size and scope. IPA’s FEL Index—the composite measure of FEED and execution planning maturity—was assessed and we found the FEED and planning work were about as good as they can get, which in our risk model means less contingency and narrower ranges.
For reference, “about as good as you can get” means the process design work was done, plot plans were issued for design, P&IDs were complete, a sized equipment list with firm quotes was developed, and so on. In addition, the project team was aligned (with clear roles and responsibilities) and included all key project functions. Finally, the team had detailed engineering, procurement, construction, and execution plans; a detailed Level 4 schedule loaded with critical engineering and construction resources; and control and handover procedures and requirements. In other words, the team members knew exactly what they wanted to build and how they were going to build it. Definition like this before authorization, unsurprisingly, is highly correlated with precise cost estimates. This is noteworthy because we often see megaprojects with gaps in the FEED work and execution planning. Boon number 1 for the project!
Finally, we benchmarked the project’s cost and schedule. Often, even very detailed and thought-out cost estimates and project schedules benchmark very aggressively. That is, when we compare the cost and schedule estimates to what Industry typically pays in cost and takes in months for a like scope, the estimates are well below the norm, indicating a big risk for the project. For this pharma megaproject, our benchmarks indicated that the team had set a reasonable cost target. Boon number 2!

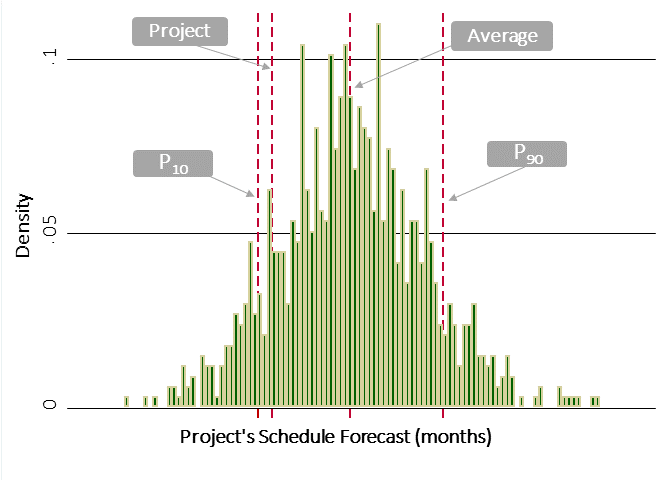
The schedule, however, was another story. Like our risk algorithm, IPA maintains scope-based cost and schedule benchmarking algorithms. The algorithms predict cost and schedule based on size and scope characteristics. In this case, the schedule target sat at around the 15th percentile. In other words, based on empirical performance for like projects, the schedule had a less than one in six chance of success. Meeting it was not impossible—but also not very likely.
HOW IT TURNED OUT
The schedule risk that IPA identified was a big eye opener for the team. In addition to the low probability of meeting the target, the range around IPA’s P50 impressed upon the team that the odds of delivering the project as planned were too low. As a result, the team worked with the business sponsor to relax the schedule expectation and devised a visibility and reporting process to ensure any delays—big or small—were identified in real time to promote timely intervention. The project is on-going and still on track, all facilitated by the benefit of history.